After following some R-related quant finance blogs like Timely Portfolio, Systematic Investor or Quantitative thoughts- to name some of my favourites - I decided to start my own. I'll first focus on R snippets which come in handy, and will potentially expand to quant trading and backtesting as time allows.
I'll start with a simple graphical boxplot analysis of "days of the week effects" with two R snippet/tidbits regarding:
- How do you adapt the ggplot2 plotting of boxplots to a mundane 50%-box 95%-line 5%-dots view?
- How do you subdivide your days in weekdays easily and robustly?
Lets jump directly into the code which can be downloaded at https://gist.github.com/1974563:
Running the code, we get following output:
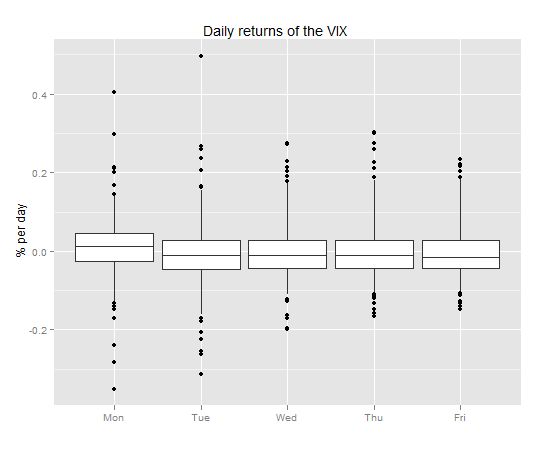 |
| From MarginTale |
These boxplots now show 50% of the observations in the box, the vertical lines cover 95% and the dots 2.5%. I find this easier to communicate than the standard definition. This is implemented in the functions myBoxPlotSummary and myBoxPlotOutliers which are in turn called from stat_summary in ggplot.
A second issue I tripped over is the sorting of days in the above boxplot. If one uses the obvious way and just defines a factor as "weekdays(index(...))" then the plot function will alphabetically sort the days - not exactly what you want. If you then try to order the factors, your solution will depend on how locale (the language you use) specifies the abbreviations of the weekdays. A robust solution shown in the code is to use the function .indexwday from the package xts.